Motivation
The NBA discourse often centers around the players’ talent and performance, and deservedly so. Factors like coach or teammate quality and general roster construction sometimes find their way into the discussion, leading to ratings such as overpaid or a bargain based on the court of public opinion. However, the salary cap is a forcing function and creates a near zero sum game where one player’s salary affects others on the team, which in turn impacts players’ on court roles. The salary construction of the team and the tools available to the front office are massively important to players’ context, and even if tracing through a team’s transaction history is often a fool’s errand, there is room for this data to influence public analysis more. To that end, I went about collecting salary data as far back as possible and attaching it to NBA data.
My initial questions were simply around how height, weight, position, and age influence salary so that I could confirm (or reject) anecdotal assumptions about things such as taller players getting paid more. The elephant in the room is, of course, the NBA’s Collective Bargaining Agreement (CBA) and all of its complexities that determine the salary cap and contracts. Each CBA lasts about 5 to 7 years and is renegogiated at the end of the period, typically attempting to solve perceived shortfalls in the previous one through devices such as the amnesty provision, maximum salary numbers, and changing exception levels. Individual player contracts are rarely made completely public and instead the data generation process must rely on media reports for the contract breakdowns. This makes it a difficult data set to both compile and analyze, but I believe it’s an important piece of the puzzle.
Data Collection
Challenges
The data is around in varying levels of accessibility on websites such as Patricia Bender’s website, without which I’m not sure any of this would exist, as well as HoopsHype and Basketball Insiders. After struggling to scrape and parse Bender’s numbers due primarily to formatting changes from year to year, I found HoopsHype’s numbers that are more accessible for scraping and compiling into one data set. The next step was connecting it to NBA player data such as height, weight, position labels (G / F / C), and date of birth, most of which I had on hand from a previous project.
Unfortunately joining the data sources was not straightforward due to differing names, players only showing up in one data set, and miscellaneous things like Jaren Jackson and Jaren Jackson Jr. both being in the data set. I cleaned the names and joined based on name, team, and year before manually working through the rest of the mismatches, which was made especially painful after accidentally overwriting my progress twice. The biggest issue causing the mismatches or null data on one side of the join was players who were ostensibly brought into training camp and therefore had a contract, but did not get into any games and so did not have a player page on NBA.com. There was some incorrect birth date data on the league’s website and other players had missing heights or weights, so I pulled all of that missing data from RealGM or Basketball-Reference. The finished data set included 14544 rows of data spanning the 1990-91 season to 2018-19 and included name, team, salary, salary adjusted for inflation, salary as a percentage of the cap, height, weight, position, and age.
Analysis
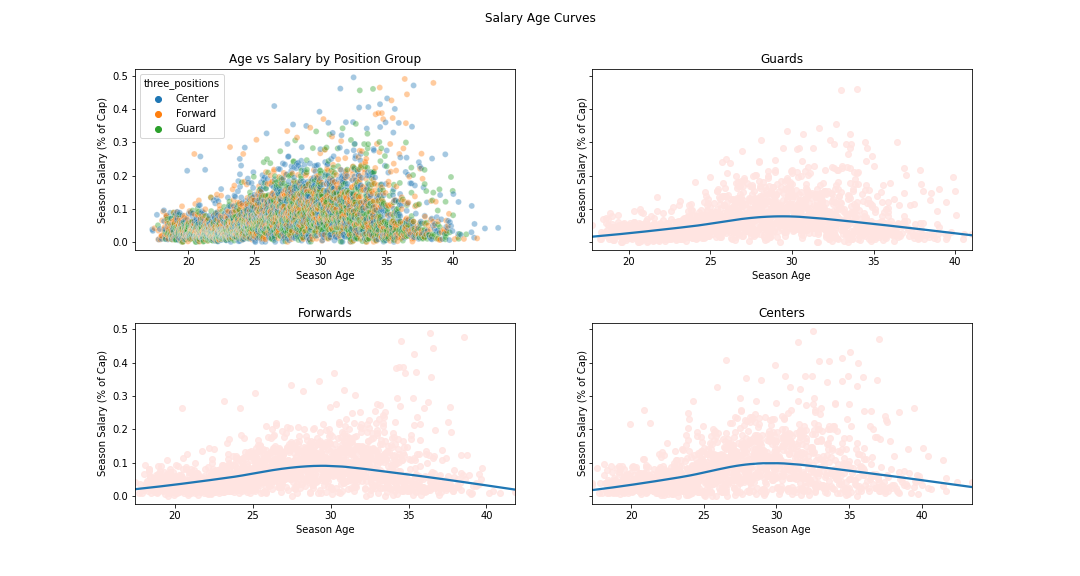
The initial analysis was creating a salary equivalent to the common player aging curve to capture the idea of a “prime” in terms of money and more directly address how salary fits into player and team evaluation discussions. While I successfully created curves for each of the Guard, Forward, and Center positions, their current utility is not very high due to the lack of metadata and the static position labels. Each position begins just above 0 at about 2% of the cap and reaches a peak value around age 29 of around 10% of the salary cap before tapering off as the player ages to final values slightly higher than the beginning of their career.

If you have knowledge of the CBA, then none of this is surprising. Players are restricted to rookie contracts upon entering the league and are then able to sign contracts with a variety of structures after several years in the league. The dispersion of salary for older players is apparent as some receive max contracts worth 30-35% of the cap while others sign for the veterans’ minimum at just above 0% of the cap. Of course, there are others whose later years are not included in the data set at all as they are unable to remain in the league. Knowing this and inspecting the endpoints of the player age distribution shows the large impact selection bias has on the youngest players enter the league at around 18 and the oldest exit after 40. However, players are only in the league at these extreme ages if they are very good, shown by the average first and last year ages in the data set being 22.8 and 27.7 years old, respectively. If someone is 18 and in the league, then they were likely a first round pick and thus will command a salary above the minimum. Many other players enter the league between 22 and 24 years of age and are not all first round picks, so there will be many more data points at the league minimum to drag the curve down. On the other hand, older players will only stick in the league if they are good enough or named Udonis Haslem, and the league minimum increases with years in the league while the amount it counts against the salary cap stays constant after 3 years in the league and we are using the actual salary and not what it counts against the cap in this data. These data artifacts influence the analysis and are things I hope to address more directly in subsequent analyses once more metadata is added.

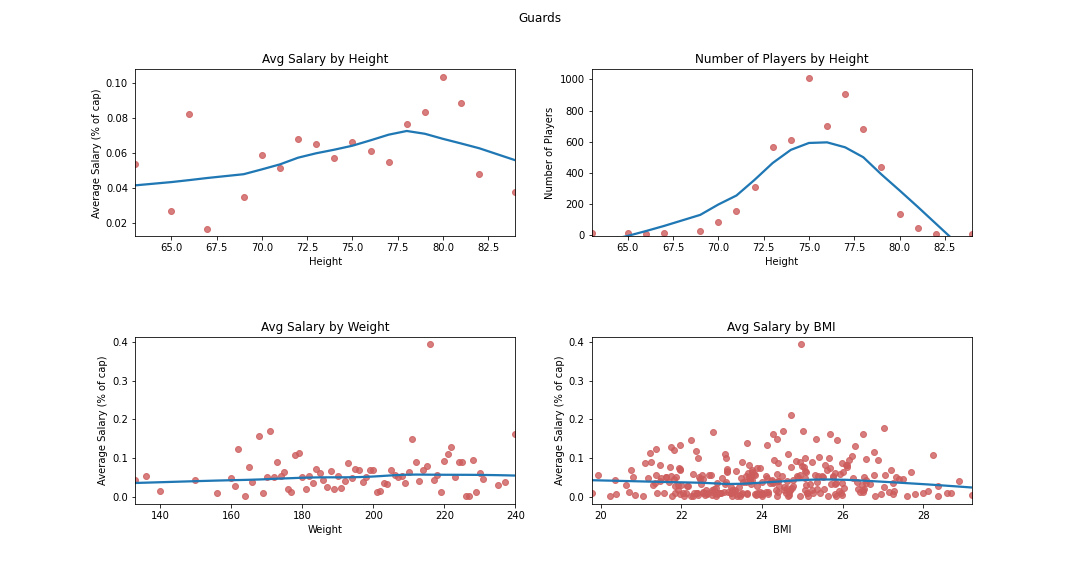
In addition to player age, I wanted to compare average salaries to player height, weight, and BMI for each position. Average salary is a bit crude and might misrepresent some players if they had a particularly spiky salary curve, but it’s a good first pass at the data. Only height has any sort of relationship with salary, though that’s consistent across all positions, and weight and BMI are more or less flat with small peaks towards the middle of the ranges.
Conclusion
The salary cap is a crucial part of the NBA, but one that remains a bit mysterious due to years of patchwork rules fixing whatever issues popped up during the previous CBA. It also falls through the cracks of most statistical analyses as they tend to focus on the on-court product or evaluating roster decisions from events such as the trade deadline or the draft. This project will hopefully help fill that gap and, though it was a bit arduous with the data acquisition and cleaning, it was rewarding. The data set adds another set of dimensions to cut analyses by and I think there is more juice to squeeze from the data as more metadata is added.
This analysis itself was not quite as useful as I hoped, though the age curves line up with expectations and the supplementary curves for height, weight, and BMI are also useful. They are some of the first things we learn about players - well, not BMI - and it’s good to see how they might inform players’ salaries.
Next Steps
The analysis fell short in a couple of ways, but luckily areas for improvement are not lacking and relatively clear, at least for the end goal.
Direct data set
Improvements to the data set are clearly needed for it to become more useful, including updating it to include the most recent seasons, which is the easiest improvement. The other dimension to add is contract metadata such as type of contract (max, rookie, etc), length, and which CBA it was signed under. All of this information would make it easier to categorize and segment the contracts for more appropriate analysis on how it impacts player salaries. Adding a feature for years spent in the league would also be useful since that plays into several different types of contracts and impacts how a player’s salary might differ from his cap hit.
Other uses
As mentioned earlier, salary data can be used as an additional dimension in many more common types of analysis. Most of the existing research leveraging salaries uses it in conjunction with all in one metrics such as RAPM to see if offense or defense is rewarded more and which players are overpaid or bargains based on the stat and their contract. I want to fold it in to team building analysis to see how successful teams are built, trace the pathways stars take, and see how skills or roles get paid. Looking at a player’s last contract before exiting the league could potentially help address the survivorship bias that often plagues any sort of aging curves, so that would be another interesting dimension to add when combining salary and performance data for age analysis.
Comments